
🤝 Top Collaborators
🤓 Latest Submissions
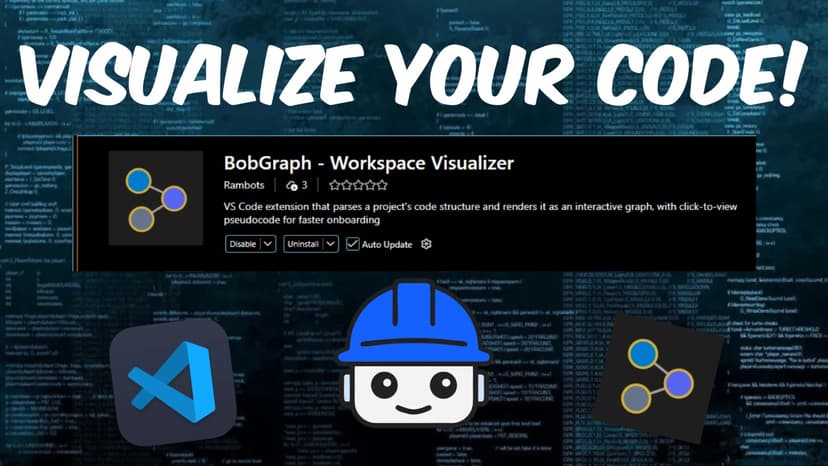
BobGraph: The WorkSpace Visualizer
When a developer joins an unfamiliar codebase — or returns to one after months away — the first hours are almost entirely wasted on orientation. There is no map. They open file after file, trace imports manually, sketch a mental model that collapses the moment they close their editor, and then repeat the entire process the next day. The larger and older the codebase, the worse this gets. For teams working inside IBM Bob, the gap is even sharper: Bob can answer questions about individual files, but there is no visual layer that shows how those files relate to one another, making it hard to even know which file to ask about. BobGraph — Workspace Visualizer solves this directly. It is a VS Code extension that turns any codebase into a navigable, interactive dependency graph in a single command. The user runs BobGraph: Generate Workspace Graph from the Command Palette and within seconds the entire project is rendered as a live visual map: one node per file, colour-coded by type, with edges showing which files import which. From there they can hover any node to highlight its connections, click it to read an AI-written plain-language summary of what that file does, double-click to drill into a semantic flowchart of the file's internal structure — functions, classes, decision points, entry and exit nodes — and press Open in IDE to jump straight to that line in the editor. The target users are developers onboarding to an existing project, engineers returning to code they have not touched in months, and code reviewers who need a structural overview before reading a pull request. The workflow is: open VS Code, run one command, read the map, ask questions by typing into the built-in AI assistant panel, and navigate directly to the relevant file. No context-switching to external tools, no manual diagram maintenance, no stale documentation. What makes BobGraph creative and unique is the combination of three layers in a single, zero-configuration tool. First, a workspace-level graph surfaces the macro structure — how the project is wired together — which no IDE currently exposes visually. Second, a per-file flowchart reveals the internal logic at the semantic level (concepts and decisions, not raw lines of code), generated on demand. Third, AI-powered plain-language explanations powered by VS Code's Language Model API — compatible with IBM Bob, GitHub Copilot, or any registered provider — sit one click from any node, so understanding a component requires no grep, no reading, and no prior knowledge. The deterministic import-resolution fallback also guarantees that AI hallucinations cannot invent phantom files: every edge is anchored to a real node in the workspace. The extension ships as an installable .vsix, includes 62 unit tests covering the full data contract and graph sanitization pipeline, handles malformed AI output gracefully without blanking the panel, and adapts automatically to VS Code's light, dark, and high-contrast themes. The architecture is explicitly designed as a foundation: the message contract between the extension host and the webview panel is already wired for live Bob 2.0 model output, so as the AI analysis backend matures, the visual front-end requires no changes to display real, dynamically generated graphs.
27 Sep 2026
